In 2021, I went back to school to get my GIS certificate at Portland Community College. Below are just some of the projects I worked on during my time in school.
Crater Lake National Park
The design goal here was to create a map of Crater Lake National Park that was aesthetically pleasing while still easy to read. I chose to target my map at hikers of the Pacific Crest Trail, highlighting an alterative route that takes you directly past Crater Lake itself.
Data was taken from the National Forest Service, and the map was created entirely in ArcGIS Pro.
Bioswale Locations within SE Portland
This series of maps tells a story about finding a new location for a bioswale within the confines of Southeast Portland neighborhoods. Using data from the City of Portland as well as USGS, I analyzed the slope and TWI (topographic wetness index) to find the best spot for a bioswale. I then compared my results to existing bioswales in the area and found a 1 mile radius in which a new bioswale would be helpful and successful.
Interactive Maps:
Walking School Bus Routes (Oregon Walks)
This story map explains the project that I took on for Oregon Walks, a local nonprofit focused on creating safe walking routes within Oregon. At the end of the story map, you can see my final web map in which I created walking school bus routes for Shaver Elementary, Prescott Elementary, and Parkrose Middle School. The web map will be featured on Oregon Walks’ website as a way for students and parents to find their best walking routes to school.
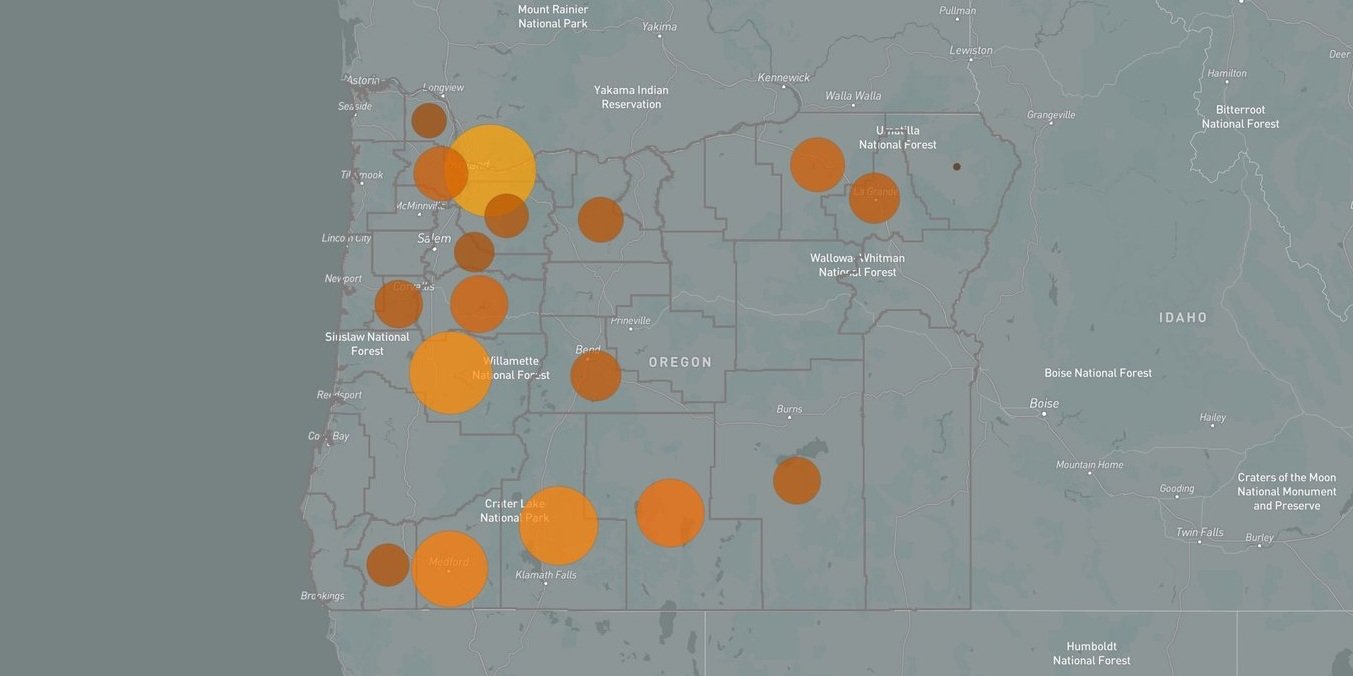
This story map explores the relationship between the west coast’s wildfire season and how that affects air quality. At the very end of the story map, you’ll find 2 web maps that compare and contrast air quality data from the year 2000 and the year 2020. Along the way, you can read about the history of wildfires and why they may have become more prevalent in recent years.
Why your Allergies May be Getting Worse
In this story map, you can read about the relationship between urban street trees and allergens in the air. If you have allergies, you might just discover why they’ve been getting worse in recent years. At the end of the story map, you can explore the online web map that I created using survey data from local Portland residents (and you can fill that survey out yourself if you’d like to!).


